사업 소개

 사업 소개
터널분야
터널내화
내화기준
사업 소개
터널분야
터널내화
내화기준
내화기준
1. PIARC(상설국제도로협회) 및 ITA(국제터널협회) 내화기준
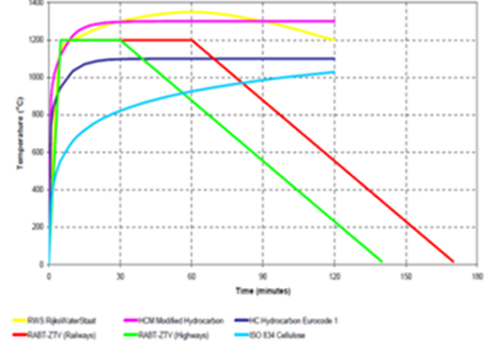
RWS(최대온도 : 1350℃ ←300MW급, 2hr)
HCM(최대온도 : 1300℃ ←300MW급, 2hr)
RABT(최대온도 : 1200℃ ←100MW급, 1.0hr이상)
HC(최대온도 : 1100℃ ←100MW급, 2hr)
ISO-834(최대온도 : 1030℃ ←20MW급, 2hr이상)
화재온도 기준
콘크리트: 표면온도가 380℃ 이하
철 근: 250℃ 이하
2. Fire Scenarios of Fire Load Specifications
RWS curve:
Specified by the Rijkswaterstatt, the Netherlands Ministry of Transport and one of the most widely used fire load curves for tunnels and is almost identical to the one specified in these guidelines. The RWS curve simulates a 50m³petrol tanker fire with a fire load of 300MW lasting for 120 minutes. Originally based on testing in 1979, the curve has recently been verified following full scale tests in the Runehamar tunnel in Norway in the frame of the UPTUN project ordered by the European Commission. The tests demonstrated that fires by large vehicles develop temperatures as described by the RWS time – temperature curve. The requirement is that the temperature of the reinforcement should not exceed 250℃ and the interface between the fire protection and the concrete should not exceed 380℃.
Hydrocarbon curve (HC):
Developed for smaller hydrocarbon/chemical fires including those for the offshore and petrochemical industries where the fire is often less contained but the curve has also been used for tunnels and structures covered by Eurocode 1.
Modified Hydrocarbon curve (HCM):
A more severe version of the HC curve, developed to meet French regulations. Recently, it has been proposed to replace the RWS curve with the HCM modified The RWS curve has a maximum temperature of 1350℃. The HCM curve has maximum temperature of 1300℃ (both temperatures are near the melting temperature of concrete) but maintains it for a longer period than the RWS. The situation at the current time is that the RWS curve is still the more prevalent of the two and that some organisations are proposing that the RWS and HCinc live side-by-side and are essentially similar in terms of fire severity. It should be noted that fire “severity” is not only measured by the rate of heating (i.e. rate of temperature increase) and the maximum temperature, but also by the duration of the fire. Some fire curves contain a cooling branch, considered to represent more realistically the actual fire load scenario in tunnels.
RABT ZTV curve:
German requirement for tunnel fires. temperature rises rapidly to 1,200℃ after 5 minutes, this temperature is maintained at a constant value for 25 minutes for highway tunnels and 55 minutes for train tunnels. It is then followed by 110 minutes of constant cooling to reach 20℃. The requirement is that the temperature of the reinforcement should not exceed 300℃.
IS0 834 curve:
Similar to the Cellulosic curve and given in some National Standards e.g. BS 476 DIN 4102, AS 1530. Originally intended for building applications and based on the burning rate of materials used in general building construction but it also been used for tunnels.
Dublin Port Tunnel (DPT):
Fire curve for tunnels in which the temperature rises rapidly to 1020℃ after 10 minutes, 1170℃ after 15 minutes, 1190℃ after 20 minutes and 1,200℃ after 30 minutes. The 1,200℃ temperature is maintained at a constant value up to 120 minutes from start of the fire. It is then followed by a linear cooling rate commencing 120 minutes from start of fire to reach 20℃ after 230 minutes from start of fire.
전화 031-698-4200 | 팩스: 02-597-4110
공장 : 경기도 이천시 부발읍 황무로 1605번길 175 | 전화 : 031-636-4203
COPYRIGHT BY HONG G ALL RIGHT RESERVED
 TOP
TOP